Listed as Free on Udemy when checked on 24 October 2026. No coupon or subscription trial is required for the listed lessons. Enrollment needs a Udemy account; availability can change.
About this course
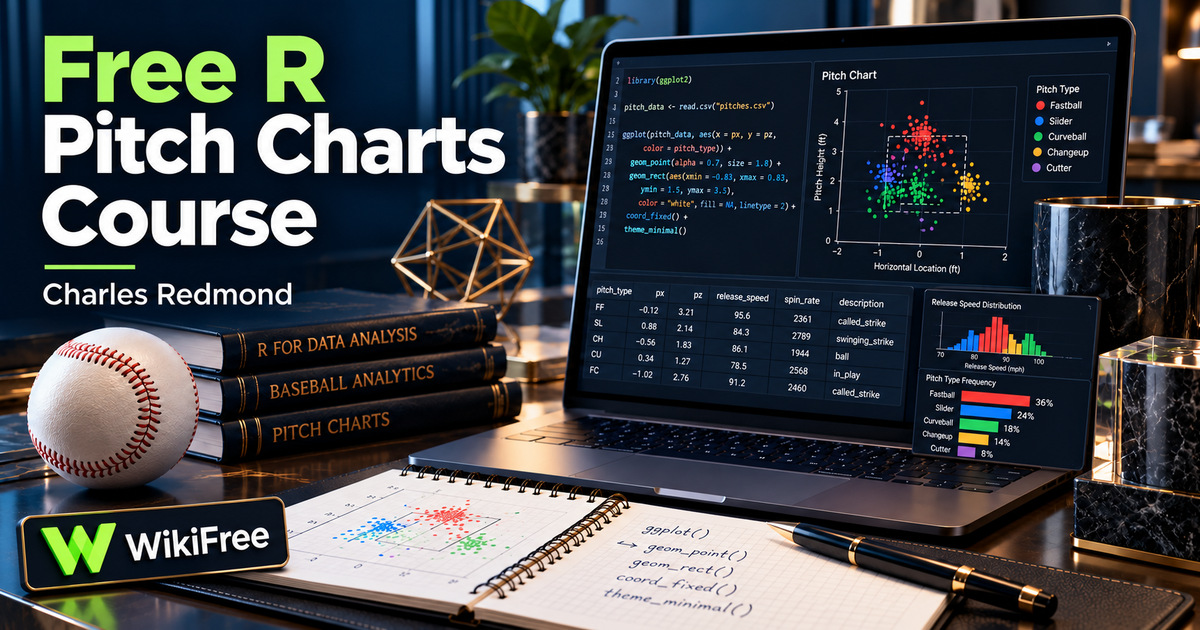
A pitch-location chart can show more than where a baseball crossed the plate. This free R course develops visualizations of pitch type, speed, sequence and at-bat context, using a single game as a focused data project.
Charles Redmond combines data preparation with detailed ggplot work. The emphasis is the process of constructing and refining charts, rather than predictive sports models or gambling decisions.
| Official course | Pitch Location Charts with PITCHf/x and ggplot |
|---|---|
| Created by | Charles Redmond |
| Platform | Udemy |
| Language | English |
| Level | Intermediate — Udemy listing |
| Listed duration | 131 minutes; 37 lectures across 6 sections |
| Certificate | Not included with a new free enrollment |
Skills you’ll gain
- Join pitch and at-bat data frames
- Subset observations and select useful columns
- Map pitch location, speed and type to visual properties
- Use factors to control labels and ordering
- Create faceted charts with text annotations
- Automate plot export through an R loop
The first section introduces PITCHf/x data, collection and joins. Later lessons build a strike-zone outline and map locations, speeds and pitch descriptions. Work with which, factors and color palettes helps keep the chart meaning consistent.
Faceting then separates batters or at-bats. The course labels pitch order, counts pitches and uses seq, lapply and unlist before moving to PNG export and a loop. The closing lessons address color and speed-mapping problems discovered during development.
The listing reports 131 minutes across 37 lectures and asks learners to install R and RStudio. Some familiarity with R, dplyr and ggplot is helpful despite not being mandatory. This is a legacy data workflow; current availability of the original PITCHf/x endpoints and the behavior of old packages have not been verified.
R and a suitable free editor can support practice. If the original endpoint no longer works, a compatible archived dataset or a synthetic table can be used to explore plotting ideas, but that will require adapting the collection step. The course code has not been executed end to end in a current environment.
Frequently asked questions
Is this a sports-betting course?
No. The reviewed syllabus concerns R data preparation and visualization of baseball pitches.
Are the original data downloads guaranteed to work?
No. The original endpoint and old package behavior need separate current verification.
Do I need prior R experience?
It is helpful. The listing recommends some R, dplyr and ggplot familiarity.
Checked on 24 October 2026 using the public course details and syllabus. WikiFree has not watched every lesson or tested full playback. New free enrollments do not include a Udemy completion certificate, instructor Q&A or direct messages.
Questions & discussion
Share a useful question or correction. Comments appear after moderation. Please avoid personal or sensitive information.