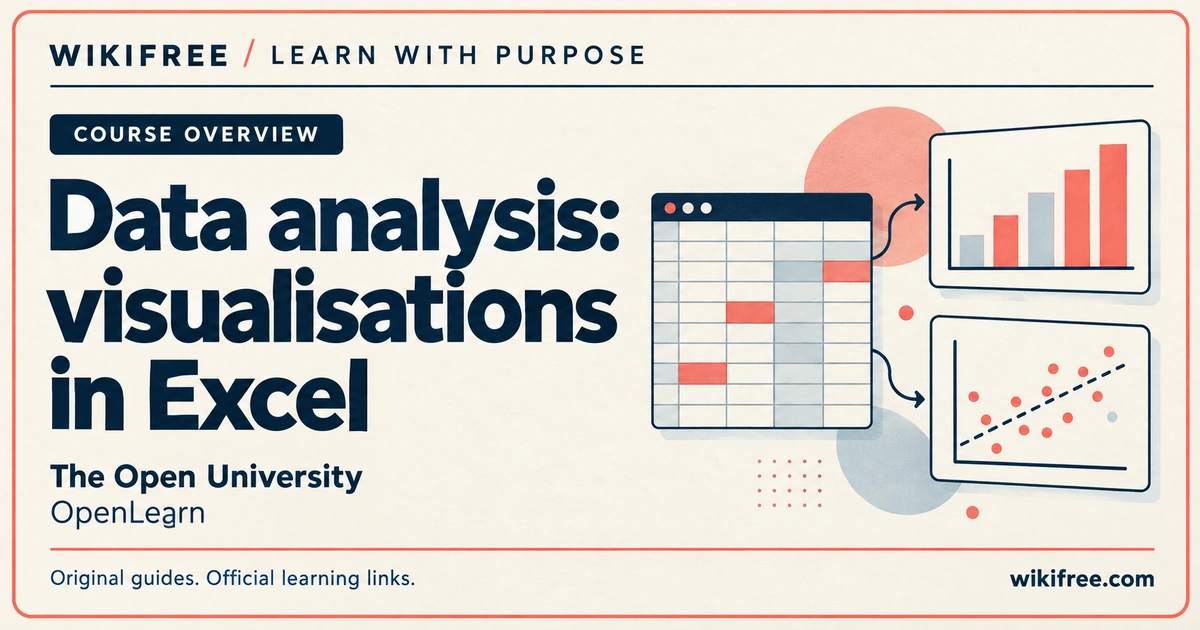
A spreadsheet becomes more useful when you can explain what its numbers mean. Data analysis: visualisations in Excel, from The Open University, introduces the connection between an organised table, a suitable visual and a clear interpretation. It is a focused starting point for learners who want to move beyond entering figures and begin asking better questions about their data.
Available on OpenLearn, the course combines introductory explanations with spreadsheet practice. You will explore how to summarise a single variable and how to examine two variables together. The learning materials are free; access to software that can complete the practical activities is a separate requirement.
Course at a glance
| Provider | The Open University |
|---|---|
| Platform | OpenLearn |
| Level | Beginner |
| Language | English |
| Study estimate | 6 hours; self-paced |
| Format | Reading, spreadsheet activities and quizzes |
| Access | Free learning materials; compatible spreadsheet software required separately |
| Recognition | Free Statement of Participation after completing the enrolled course; no formal qualification credit |
What you’ll learn
- Prepare information for analysis: explore spreadsheet functions used to organise data around a business question.
- Summarise one variable: work with frequency tables and histograms to examine a distribution.
- Compare two variables: explore contingency tables and scatter diagrams.
- Explain a visual: consider how tables and graphics communicate information to a reader.
- Describe relationships: examine independent and dependent variables when interpreting two variables together.
Skills you’ll gain
- Spreadsheet organisation
- Frequency tables
- Histograms
- Contingency tables
- Scatter diagrams
- Data interpretation
From a table of figures to a useful explanation
The learning sequence starts with working in a spreadsheet, then moves into univariate and bivariate visualisation. That progression gives the chart a purpose: first understand the information you have, then decide which comparison or pattern you want to make visible.
For an optional personal exercise, create a small fictional table of planned and completed study hours. Use clear column names and consistent units. Write down one question before making a chart, such as whether completed hours vary substantially between sessions. Keep the original table beside your visual so that the result remains easy to check.
Then try expressing your finding in one plain sentence. If the sentence depends on a detail the chart does not show, revisit your choice of labels or grouping. The goal is to make the explanation easier to follow, rather than add decoration. This extra exercise is a way to practise your thinking; it is not an OpenLearn assessment.
Choose the right practical setup
The course specifies Microsoft Excel or a similar spreadsheet program. Its worked instructions use Excel, including the desktop Data Analysis ToolPak, which is used in the histogram activity. A different spreadsheet application may organise equivalent features differently, so matching the concepts does not establish that every supplied step will work unchanged.
The software-access section describes Microsoft 365 access for eligible Open University students. Enrolling on a free OpenLearn course does not make every learner an Open University student or provide a universal desktop Excel licence. Before starting the practical work, check that you can open the supplied spreadsheets and perform the required analysis with tools you can lawfully access.
If you are relying on free software, confirm compatibility with the actual activities rather than assuming that a browser spreadsheet covers them all. No completely free compatible route for every practical activity is promised here. Reading the course and accessing the necessary software are separate decisions.
Build confidence with small, checkable examples
This subject is useful when you want a clearer way to explain a simple dataset in a report, presentation or discussion. Start with a modest practice example rather than consequential live records. After producing a table or chart, trace a few displayed values back to the cells they came from.
Pay attention to blank entries, zeros and units: they can change what a reader thinks a result means. If you create a second visual from the same data, compare the scale and grouping before interpreting a different appearance as a different finding. Keep a short note explaining your choices so you can revisit them later.
The six-hour figure is the provider’s study estimate. Allow your own pace for setup and practice, especially if spreadsheet analysis is new to you. Finishing the reading is a beginning; being able to explain why your visual fits your question makes the learning more useful.
Study freely and record your progress
You can read the public course pages without creating an account. A free OpenLearn account enables enrolment, progress tracking and access to all quizzes and activities. To receive the free Statement of Participation, enrol, read every course page and submit any included quizzes. The statement records completed study and does not carry formal credit towards a qualification.
Frequently asked questions
Are the course materials free?
Yes. The OpenLearn learning materials are free. A free account gives access to progress tracking and all course activities; compatible spreadsheet software is a separate requirement.
Do I have to use Microsoft Excel?
The course permits Excel or a similar program, but its instructions include the desktop Data Analysis ToolPak. Check your chosen software against the practical activities before starting; full compatibility with a free alternative is not promised.
Does the participation statement award academic credit?
No. The free Statement of Participation records completed OpenLearn study and does not carry formal credit towards a qualification.
Questions & discussion
Share a useful question or correction. Comments appear after moderation. Please avoid personal or sensitive information.