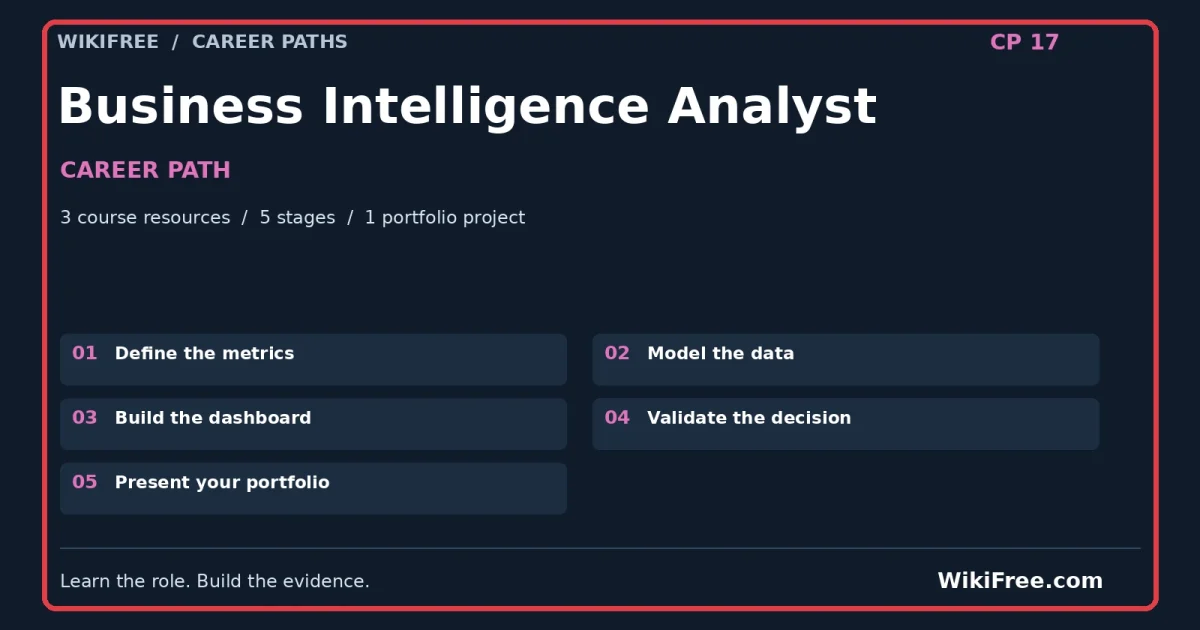
Career studio / Business Intelligence
Build evidence for the Business Intelligence Analyst role
A subscription learning service has multiple teams reporting different definitions of active customers. Design a small semantic model and dashboard that separates revenue, customers and support activity.
Your outcome: BI metric dictionary, star-schema sketch and dashboard specification.
Start with the right expectations
Who this is for
Spreadsheet skills; a free local spreadsheet can substitute for proprietary dashboard software.
This path develops a demonstrable work sample for the named role. It does not replace employer-specific experience, professional qualifications or supervised practice.
Plan your study time
Use a flexible six-week project schedule: one week for each of the first four stages and two weeks for the portfolio and review. Allow roughly 3–5 hours per week for the case work, in addition to course study. This is a planning suggestion, not a measured course duration or a promise of job readiness.
Read the course access notes before starting. Free viewing or reading does not automatically include certificates, graded assessments, software licences or paid cloud resources. Core case work can be documented with a free editor and spreadsheet; optional implementation tools may have additional requirements.
Your course sequence
Start in the order below. Use the course outline to select the sections relevant to the stage tasks, and complete foundation exercises before moving on. Full provider courses can be substantially longer than this project schedule. These are course resources, not a claimed count of individual lessons.
Resource 01 / Google
Free Business Intelligence Course: Pipelines and Dashboards
Purpose: Build the foundations. Connect your notes to the case tasks below rather than only collecting completion marks.
Access: Free Video
Certificate: Free video viewing; Google certification is not included
Resource 02 / Learn Skills Daily
Power BI Data Analysis: Free Course
Purpose: Develop the role-specific method. Connect your notes to the case tasks below rather than only collecting completion marks.
- Follow a staged Power BI learning route from introductory work to more demanding analysis demonstrations.
- Connect the structure and preparation of data with the meaning of a report.
- Use the later classes to examine more advanced reporting work and explain the decisions behind it.
Access: Free Video
Certificate: Free video viewing; certificate not included
Resource 03 / Harvard
CS 50’s Introduction to Databases with SQL
Purpose: Strengthen practical application. Connect your notes to the case tasks below rather than only collecting completion marks.
- Query relational tables and connect records using primary and foreign keys.
- Model entities and relationships, choosing appropriate data types and constraints.
- Create, update and delete information while maintaining a clear database structure.
Access: Free CS 50 OpenCourseWare material and free development tools; free edX and GitHub accounts for assignment submission and free-certificate workflow. No required paid hosting or software.
Certificate: Free CS 50 certificate after at least 70% on every required problem and the final project; no automatic academic credit.
Learn, make, check
Keep a decision log as you work. For each stage, capture the assumption, your work product, a check and the change you made after that check. The acceptance criterion is the stopping condition for the stage.
Stage 1 / suggested project week 1
Define the metrics
Understand: Metrics need a grain and a business rule.
Make: Specify active customer, net revenue and support volume with exclusions and date logic.
Check before moving on: Two reviewers should be able to calculate the same measure.
Study companion: Free Business Intelligence Course: Pipelines and Dashboards. Use its relevant lessons and examples; the independent WikiFree task is not a provider assessment.
Save as evidence: a dated work product and a short note explaining one choice, one alternative and one remaining uncertainty.
Stage 2 / suggested project week 2
Model the data
Understand: Joining facts at incompatible grains inflates totals.
Make: Sketch customer, date and plan dimensions plus separate sales and ticket facts.
Check before moving on: Identify a primary key and grain for every table.
Study companion: Power BI Data Analysis: Free Course. Use its relevant lessons and examples; the independent WikiFree task is not a provider assessment.
Save as evidence: a dated work product and a short note explaining one choice, one alternative and one remaining uncertainty.
Stage 3 / suggested project week 3
Build the dashboard
Understand: The interface should lead from an overview to an actionable exception.
Make: Create three views and an explicit filter state; use a spreadsheet if Power BI is unavailable.
Check before moving on: A filtered total reconciles to the underlying rows.
Study companion: CS 50’s Introduction to Databases with SQL. Use its relevant lessons and examples; the independent WikiFree task is not a provider assessment.
Save as evidence: a dated work product and a short note explaining one choice, one alternative and one remaining uncertainty.
Stage 4 / suggested project week 4
Validate the decision
Understand: A dashboard is useful only if its interpretation is reliable.
Make: Test duplicate keys, missing dates and a zero-sales period; document the result.
Check before moving on: Empty data are not shown as successful performance.
Study companion: CS 50’s Introduction to Databases with SQL. Use its relevant lessons and examples; the independent WikiFree task is not a provider assessment.
Save as evidence: a dated work product and a short note explaining one choice, one alternative and one remaining uncertainty.
Stage 5 / suggested project weeks 5–6
Present your portfolio
Assemble the four work products into BI metric dictionary, star-schema sketch and dashboard specification. Write a README explaining the problem, your assumptions, the decisions you made, tests actually performed and what remains incomplete.
Give a five-minute walkthrough: one minute for the problem, two for the work and evidence, one for trade-offs and one for the next improvement. If you have not implemented a proposed system, label it a design or prototype rather than a deployed solution.
Acceptance: a reviewer can locate each work product, reproduce the key reasoning and identify the limits without a private explanation from you.
The portfolio brief
A subscription learning service has multiple teams reporting different definitions of active customers. Design a small semantic model and dashboard that separates revenue, customers and support activity.
Deliver: BI metric dictionary, star-schema sketch and dashboard specification.
| customer id | sales rows | ticket rows |
|---|---|---|
| C 1 | 2 | 3 |
| C 2 | 1 | 2 |
| C 3 | 3 | 1 |
Use these small inputs to make the reasoning visible. They are not a representative dataset, a real client engagement or evidence of production performance. Where the brief requires additional sample records, create them yourself, label them synthetic and explain why you added them.
The ZIP includes the case CSV, four stage worksheets, course sequence, decision log, test log, portfolio README template, review rubric and reference reasoning. It is a starter kit for your work, not a completed application, professional report or proprietary project file.
Check your reasoning
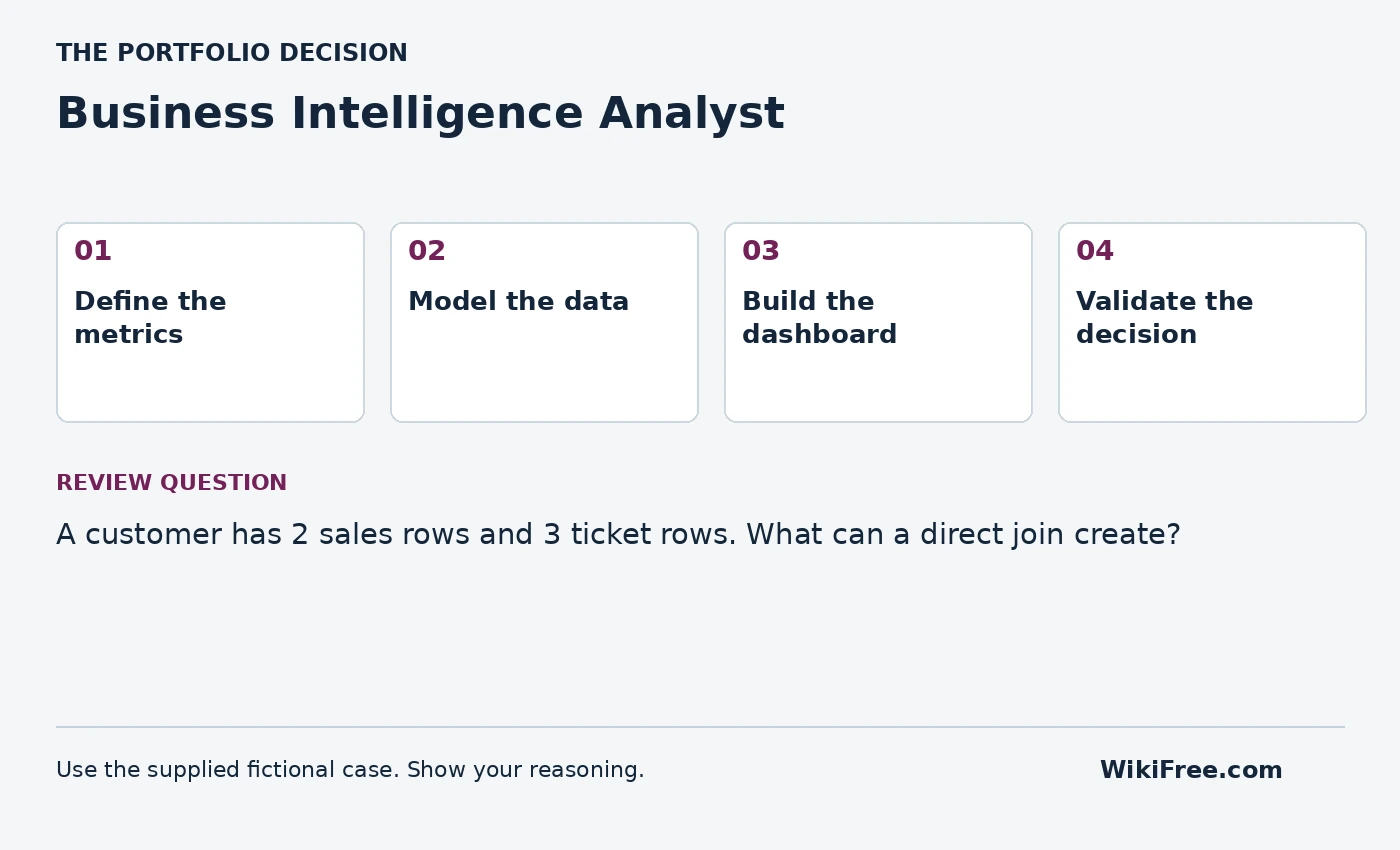
A customer has 2 sales rows and 3 ticket rows. What can a direct join create?
Write your answer and assumptions before opening the reference.
Read the reference reasoning
It can create 6 rows and multiply measures. Aggregate each fact at the intended grain or use a model that prevents fan-out before comparing measures.
Portfolio review rubric
| Criterion | Points | Evidence required |
|---|---|---|
| Problem and scope | 4 | A clear user, need, boundary and assumptions |
| Role-specific work | 8 | 2 points for each of the four stage acceptance checks |
| Reasoning and validation | 4 | Independent checks, actual results and uncertainty |
| Communication and reproducibility | 4 | A usable README, source links and reviewable work products |
Aim for at least 16/20 as a self-review target, with no missing stage acceptance check. This is a WikiFree practice rubric, not an industry credential or a hiring assessment.
Interview practice
How did you test that a filter did not change the meaning of a measure?
Answer using the case: context, your action, evidence and limitation. Describe this honestly as a self-directed project. Do not present fictional organizations, invented interviews or practice results as paid work experience.
Your progress
Use this checklist as a personal study aid. Progress is stored in this browser when local storage is available; it is not an account record or a certificate.
0 of 5 milestones complete
The lessons and projects remain readable without JavaScript. Automatic progress saving requires JavaScript.
Questions before you start
Will this path qualify me for a job?
It helps you study relevant foundations and produce a work sample. Employers may require additional skills, qualifications and experience. Review actual role requirements before applying; no job or certification is guaranteed.
Are all tools and certificates free?
The linked learning routes were selected for free viewing or reading. Follow the separate access and certificate notes on each course. Paid tools and cloud deployment are optional; document a local design when implementation resources are unavailable.
Can I follow this on a phone?
You can read the path and many learning resources on a phone. Coding, detailed spreadsheet work, design tools and mobile-app development are easier or require a suitable computer. The page is designed to reflow; that is not a claim that every physical device has been tested.
Questions & discussion
Share a useful question or correction. Comments appear after moderation. Please avoid personal or sensitive information.