Listed as Free on Udemy when checked on 21 October 2026. No coupon or subscription trial is required for the listed lessons. Enrollment needs a Udemy account; availability can change.
About this course
Different quality problems call for different ways of organizing evidence. Six Sigma Academy Amsterdam introduces seven quality tools alongside a discussion of what quality means, including Garvin’s dimensions of quality.
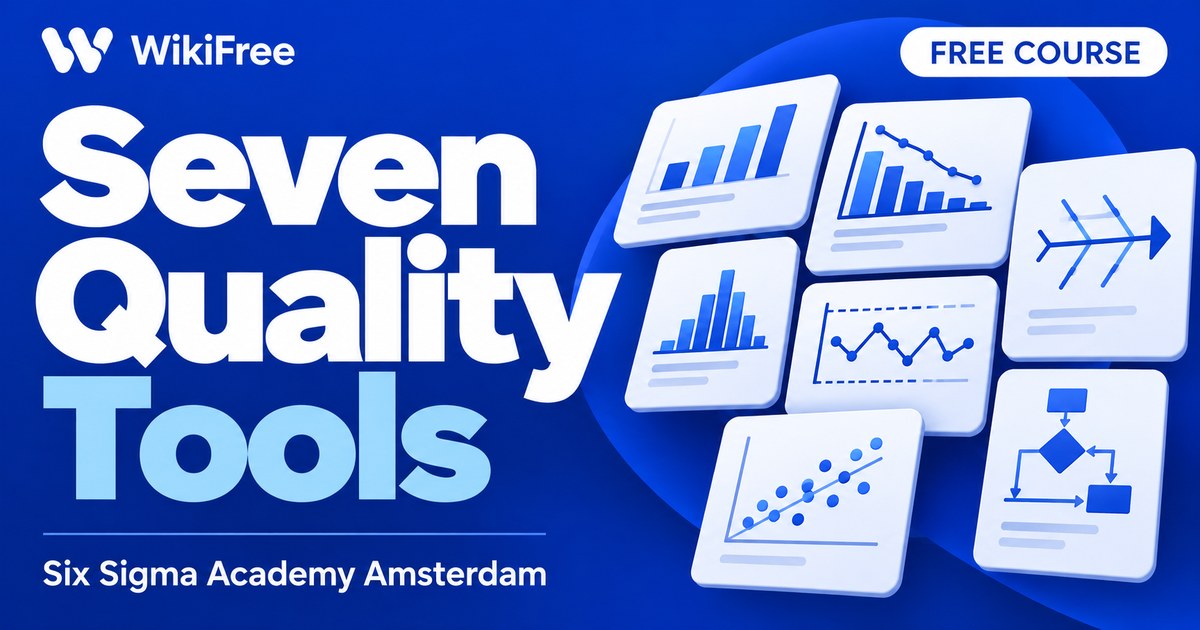
The lessons move across process maps, fishbone diagrams, scatter plots, control charts, histograms, tally sheets and Pareto analysis. Spreadsheet demonstrations connect several of these tools with calculations and charts, while the correlation section addresses outliers, non-linear relationships and the danger of confusing association with cause.
| Official course | Seven Tools Of Quality Expert |
|---|---|
| Created by | Six Sigma Academy Amsterdam (SSAA) |
| Platform | Udemy |
| Language | English |
| Level | All Levels — Udemy listing |
| Listed duration | 83 minutes; 31 lectures across 7 sections |
| Certificate | Not included with a new free enrollment |
Skills you’ll gain
- Matching a quality question with a suitable basic tool
- Organizing possible causes in a fishbone diagram
- Interpreting distributions and priorities through charts
- Recognizing limitations when interpreting correlation
No prior quality-management experience is listed. The course is a foundation in tools and interpretation, rather than a complete Six Sigma qualification or proof that a process meets a quality standard.
Some demonstrations use desktop Excel and its Analysis ToolPak, which may require a paid license. LibreOffice Calc is a free spreadsheet option for practicing underlying calculations and chart concepts, although its menus and available features differ and it will not reproduce every Excel step exactly.
LibreOffice: The free office suite includes the Calc spreadsheet application.
Frequently asked questions
Is Excel itself included for free?
No. The educational videos are free, but a license for Microsoft Excel is separate. A free spreadsheet can support some conceptual practice with a different interface.
Does a strong correlation prove a cause?
No. The syllabus explicitly considers traps in correlation. A pattern is a reason to investigate, not proof of a causal explanation.
Checked on 21 October 2026 using the public course details and syllabus. WikiFree has not watched every lesson or tested full playback. New free enrollments do not include a Udemy completion certificate, instructor Q&A or direct messages.
Questions & discussion
Share a useful question or correction. Comments appear after moderation. Please avoid personal or sensitive information.