WikiFree learning path 27 · Intermediate
The model proving ground
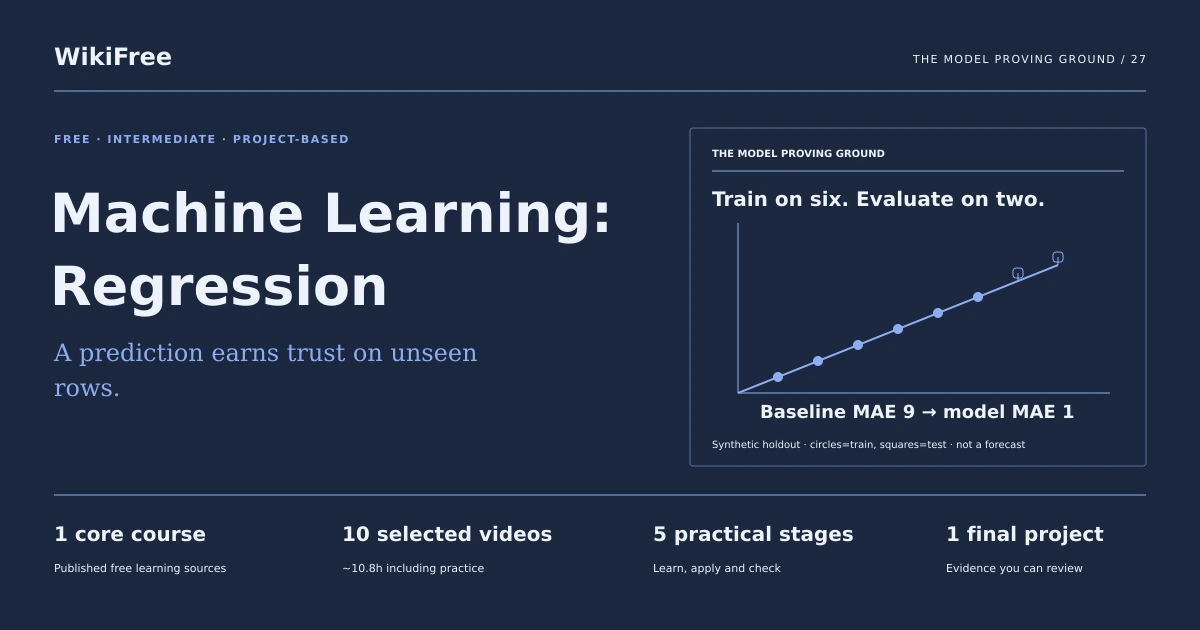
A prediction earns trust on unseen rows.
Build and evaluate a small linear-regression experiment with a held-out test set, a mean baseline and a clear limitations note.
Video duration uses the selected lessons only. Reading and practice times are planning estimates; repeat difficult work as needed.
A clear starting point
Who this is for
Python functions, lists and reading CSV files. Basic arithmetic. Complete the Python foundations path first if these are unfamiliar.
Your practical result
Build and evaluate a small linear-regression experiment with a held-out test set, a mean baseline and a clear limitations note.
This teaches regression experiment mechanics, not production forecasting, advanced ML, causal modeling or a professional credential.
Access and cost
The public videos are free. The supplied reference runs with Python standard-library modules; a notebook and scikit-learn are optional. No cloud account, paid model API or GPU is required.
The project pack contains an original workbook, case inputs, an evidence log and reference notes. Some technical paths include starter code and a runnable reference. Read the pack README before starting.
Three-minute readiness check
Answer first, then open each explanation. A missed answer identifies what to revisit; it does not stop you from starting.
Can test labels be used to fit the model?
No. They are reserved for evaluation.
What is a baseline?
A simple comparison method, here the training-target mean.
Does low error on two rows establish production reliability?
No.
The case you will work on
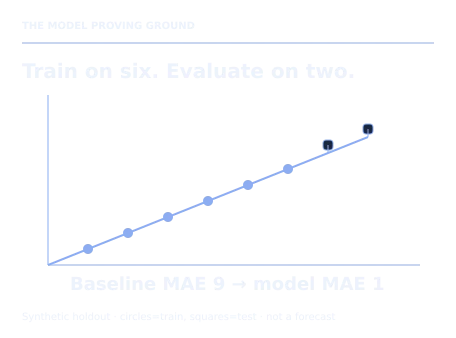
The fictional Alder Rental Lab studies a deliberately simple synthetic relationship. Training rows use activity index x=1 to 6 and demand y=12,14,16,18,20,22. Two held-out rows have x=7,8 and actual demand 25,27. This tiny pattern is for learning mechanics, not deployment.
| Split | Activity index x | Observed demand y |
|---|---|---|
| train | 1 | 12 |
| train | 2 | 14 |
| train | 3 | 16 |
| train | 4 | 18 |
| train | 5 | 20 |
| train | 6 | 22 |
| test | 7 | 25 |
| test | 8 | 27 |
These are supplied synthetic inputs, not observations from a real organization. Label assumptions and any additional data you create.
Keep an evidence trail
Save each stage output in the project folder. In evidence_log.csv, record the decision, the artifact or test that supports it, what failed, and the revision you made.
Your route from learning to evidence
- Stage 1Define the prediction and splitA prediction contract and untouched test partition.60 minutes of original practice
- Stage 2Inspect and prepare the dataA data inspection and training scatter plot.75 minutes of original practice
- Stage 3Fit a baseline and lineTwo prediction methods and saved outputs.100 minutes of original practice
- Stage 4Evaluate absolute errorA baseline-versus-model evaluation.75 minutes of original practice
- Stage 5Decide what the experiment supportsA bounded model card and reproducible run instructions.60 minutes of original practice
- Final projectMake the evidence reviewableConnect the five stage outputs and test a change.240 minutes estimated
Progress stays in this browser. Tick a stage only after its evidence check passes. This is a personal checklist, not a certificate.
Why these source courses
The path uses selected material from courses already published on WikiFree. The original exercises below connect that material to one practical outcome. Follow only the listed assignments; completing the full source courses is optional.
Microsoft
Free Machine Learning Course: Learn the Fundamentals
Selected Microsoft beginner lessons introduce regression, notebooks, cleaning, plotting and linear models; classification and ROC lessons are not assigned.
Access: Free Video
Certificate: Video viewing only; no certification exam or certificate promised
Learn it, apply it, check it
Work in order. Every stage produces something the next stage uses. Revisit the repair instruction when a check fails.
Define the prediction and split
Python functions, lists and reading CSV files. Basic arithmetic. Complete the Python foundations path first if these are unfamiliar.
The idea to use
Define the target, the available inputs and the point in time when a prediction is made. Separate training and test rows before estimating coefficients. An input derived from future demand would leak the answer. Our fixed split is an instructional convenience; it is not evidence that a two-row test represents real future conditions.
Watch the selected lessons
- 1. Introduction to Machine Learning for Beginners [Part 1]3:22
- 3. Techniques for Machine Learning [Part 3]4:07
- 5. Introduction to Regression models for Machine Learning [Part 5]3:28
Selected video time: 11m. Open this course on WikiFree.
Your 60-minute lab
Write a prediction brief, mark the split and identify two hypothetical leakage features to exclude.
Save: A prediction contract and untouched test partition..
Evidence check
Only x is used as an input and test y values do not affect fitting.
If it fails: If you tune repeatedly against these two test rows, reserve a new evaluation set.
Inspect and prepare the data
Bring your previous output: A prediction contract and untouched test partition.
The idea to use
Plot the training observations and inspect missing values, types and units. Cleaning rules should be chosen without using the held-out targets. Keep a record of every change, even when the clean synthetic dataset requires none. A perfect-looking line in training data may reflect how the teaching data was constructed rather than a natural process.
Watch the selected lessons
- 6. Set up Jupyter Notebooks to start building regression models [Pt 6]5:05
- 8. How to Analyze and Clean a Dataset [Part 8]3:33
- 9. How to Visualize Data with Matplotlib [Part 9]3:41
Selected video time: 12m. Open this course on WikiFree.
Your 75-minute lab
Load the CSV, verify eight rows and plot only the six training points first. Add explicit checks for missing or nonnumeric fields.
Save: A data inspection and training scatter plot..
Evidence check
The training set has six points and no transformation uses test target values.
If it fails: Do not fill a missing training value using an average computed over the complete dataset.
Fit a baseline and line
Bring your previous output: A data inspection and training scatter plot.
The idea to use
The mean baseline predicts the training-target mean, 17, for every case. A least-squares line estimates slope and intercept from training rows. Here the line is y=10+2x. The supplied dependency-free Python reference shows the calculation; a scikit-learn implementation is an optional equivalent. Preserve both methods so improvement is measured against something simple.
Watch the selected lessons
- 7. Your First Linear Regression Project in Python [Part 7]4:11
- 10. Understanding Linear Regression [Part 10]2:54
- 12. Linear and Polynomial Regression using Scikit-learn [Part 12]5:02
Selected video time: 12m. Open this course on WikiFree.
Your 100-minute lab
Implement the baseline and linear fit. Print coefficients and predictions for x=7 and x=8 without refitting.
Save: Two prediction methods and saved outputs..
Evidence check
The fitted intercept is 10, slope 2 and test predictions are 24 and 26.
If it fails: If predictions exactly match 25 and 27, inspect whether test targets entered fitting.
Evaluate absolute error
Bring your previous output: Two prediction methods and saved outputs.
The idea to use
Mean absolute error averages the absolute difference between prediction and actual value, retaining the target unit. On our held-out rows, the baseline errors are 8 and 10, while the line errors are 1 and 1. Report row-level errors alongside the average. Correlation alone cannot replace this error comparison, especially in a tiny, designed dataset.
Watch the selected lessons
Selected video time: 4m. Open this course on WikiFree.
Your 75-minute lab
Calculate both MAEs by hand and in code. Create a two-row error table and explain what MAE means here.
Save: A baseline-versus-model evaluation..
Evidence check
Baseline MAE is 9 and linear MAE is 1 demand unit on exactly two test rows.
If it fails: Do not average signed errors, which can cancel and disguise mistakes.
Decide what the experiment supports
Bring your previous output: A baseline-versus-model evaluation.
The idea to use
A model card should state intended use, data origin, features, split, metric and limitations. This experiment demonstrates a pipeline; it does not justify scheduling real inventory. List plausible changes in season, demand or measurement that would break the synthetic relationship. A next experiment needs new representative data and a larger untouched evaluation set.
Original practice stage. No additional video or reading assignment is required.
Your 60-minute lab
Write a model card and a next-data plan. Evaluate x=20 as an extrapolation example and explain why its prediction needs caution.
Save: A bounded model card and reproducible run instructions..
Evidence check
The report discloses synthetic data, two test rows and extrapolation beyond the observed range.
If it fails: Replace claims of accuracy in the real world with the exact measured result on the test rows.
A worked reference to compare
Training produces y=10+2x. For test x values 7 and 8, predictions 24 and 26 differ from actual 25 and 27 by one each. MAE improves from baseline 9 to model 1 on this tiny synthetic holdout only.
Compare your reasoning as well as the result. If your answer differs, state the assumption or input that explains the difference. Reference notes are for checking after an attempt; copying them is not evidence of independent work.
Your final project
Your brief
Submit the data, runnable training/evaluation script, scatter plot, error table and model card. Add a separate challenge row x=9, y=35 without refitting and explain the resulting error and a possible distribution-shift concern.
Time box: 4h 00m estimated. Extend it if a gate needs repair.
Hand in these artifacts
- A prediction contract and untouched test partition.
- A data inspection and training scatter plot.
- Two prediction methods and saved outputs.
- A baseline-versus-model evaluation.
- A bounded model card and reproducible run instructions.
- A short README: outcome, how to inspect or run the work, assumptions and limitations.
- A before-and-after change test and the completed evidence log.
Run a final review
- Use the supplied reference to reconcile the baseline result.
- Choose one relevant input or constraint to change. Write your expected effect before testing it.
- Run the calculation, walkthrough or test again and save the actual result.
- Ask a peer to inspect the evidence, or perform a separate self-review. Label which review you used.
- Score the work using the rubric and repair every critical failure.
Review rubric · 100 points
| Criterion | Points | Evidence to inspect |
|---|---|---|
| Practical outcome and case reasoning | 25 | Build and evaluate a small linear-regression experiment with a held-out test set, a mean baseline and a clear limitations note. |
| Five stage checks | 30 | Award 6 points for each stage only when its stated gate is demonstrably met. |
| Traceable evidence | 20 | Artifacts, inputs and calculations or tests are reproducible; synthetic and simulated evidence is labelled. |
| Revision after a changed condition | 15 | Change one input or constraint, predict the effect, test it and record the result. |
| Handoff quality | 10 | A reviewer can find the files, follow the instructions and understand the remaining limitations. |
Completion target: at least 80/100, all five stage gates passed, and every critical issue below corrected. This is a learning benchmark, not an accredited qualification.
Critical issue: Held-out targets never enter fitting and the baseline and model use the same evaluation rows.
Before you go further
What will I be able to produce?
Build and evaluate a small linear-regression experiment with a held-out test set, a mean baseline and a clear limitations note.
Is the whole path free?
The public videos are free. The supplied reference runs with Python standard-library modules; a notebook and scikit-learn are optional. No cloud account, paid model API or GPU is required.
Do I need to finish every source course?
No. Follow the selected assignments at each stage. Source courses provide context, while the original case, labs and final review build the practical result. Extra study is optional.
What counts as completion?
Complete all five stage checks, earn at least 80/100 on the final rubric and correct every critical issue. This teaches regression experiment mechanics, not production forecasting, advanced ML, causal modeling or a professional credential.
Questions & discussion
Share a useful question or correction. Comments appear after moderation. Please avoid personal or sensitive information.