WikiFree learning path 23 · Beginner
The uncertainty studio
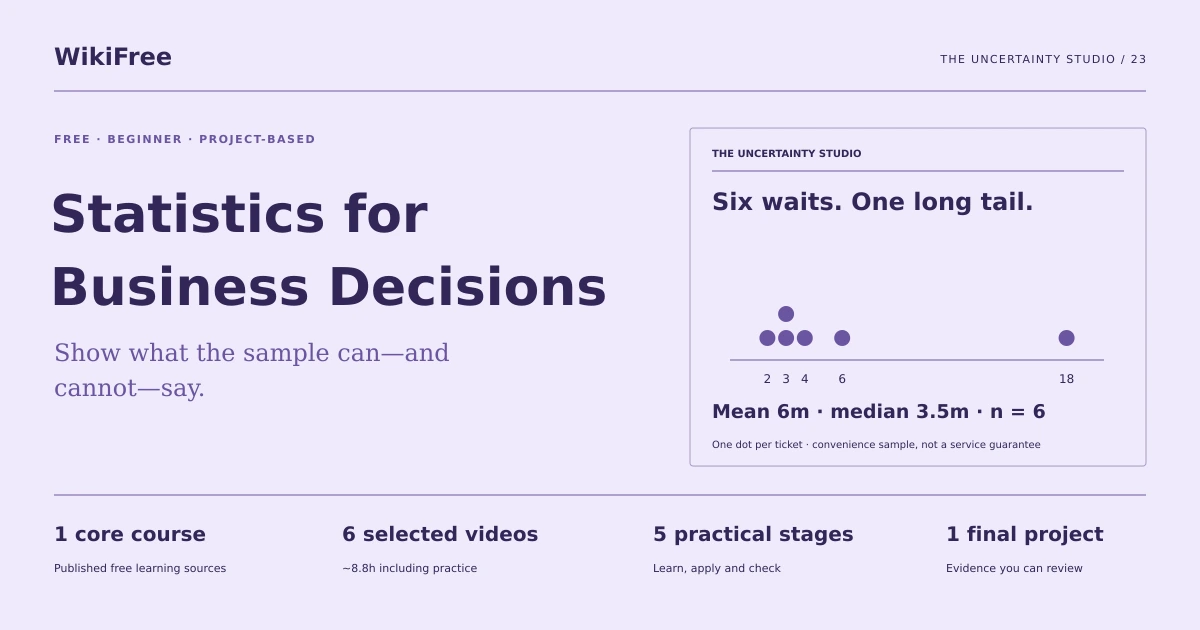
Show what the sample can—and cannot—say.
Summarize a small business sample, investigate an outlier and write a decision memo that separates observations from unsupported generalizations.
Video duration uses the selected lessons only. Reading and practice times are planning estimates; repeat difficult work as needed.
A clear starting point
Who this is for
Basic arithmetic and a spreadsheet or calculator. No calculus or paid statistics package.
Your practical result
Summarize a small business sample, investigate an outlier and write a decision memo that separates observations from unsupported generalizations.
This is descriptive statistical reasoning, not a complete inference, forecasting or experimental-design course.
Access and cost
Assigned public videos can be watched free. Complete the original case in a text editor, on paper or in a spreadsheet you already have. No paid course, exam or provider certificate is included.
The project pack contains an original workbook, case inputs, an evidence log and reference notes. Some technical paths include starter code and a runnable reference. Read the pack README before starting.
Three-minute readiness check
Answer first, then open each explanation. A missed answer identifies what to revisit; it does not stop you from starting.
Is the mean always a typical experience?
No. A skewed distribution can pull it away from most cases.
Can correlation prove a cause?
No.
Does a large convenience sample remove selection bias?
Not automatically.
The case you will work on
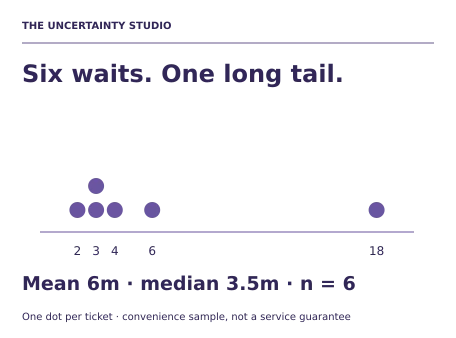
A fictional help desk records six resolved-ticket waiting times on one conveniently chosen afternoon. This is not a random sample of all customers. Units are minutes.
| Ticket | Wait minutes |
|---|---|
| T1 | 2 |
| T2 | 3 |
| T3 | 3 |
| T4 | 4 |
| T5 | 6 |
| T6 | 18 |
These are supplied synthetic inputs, not observations from a real organization. Label assumptions and any additional data you create.
Keep an evidence trail
Save each stage output in the project folder. In evidence_log.csv, record the decision, the artifact or test that supports it, what failed, and the revision you made.
Your route from learning to evidence
- Stage 1Define the population and sampleA sampling note.45 minutes of original practice
- Stage 2Describe center and spreadA labeled descriptive table and dot plot.55 minutes of original practice
- Stage 3Investigate the long waitAn outlier investigation and sensitivity comparison.50 minutes of original practice
- Stage 4Separate relationship from explanationA follow-up study plan.45 minutes of original practice
- Stage 5Write a proportion carefullyA bounded statistical decision memo.50 minutes of original practice
- Final projectMake the evidence reviewableConnect the five stage outputs and test a change.150 minutes estimated
Progress stays in this browser. Tick a stage only after its evidence check passes. This is a personal checklist, not a certificate.
Why these source courses
The path uses selected material from courses already published on WikiFree. The original exercises below connect that material to one practical outcome. Follow only the listed assignments; completing the full source courses is optional.
Aswath Damodaran
Statistics for Finance: Free Course
Selected public statistics lessons cover sampling, description, distributions, relationships and probability; finance applications are not assigned.
Access: Free Video
Certificate: Free video viewing; certificate not included
Learn it, apply it, check it
Work in order. Every stage produces something the next stage uses. Revisit the repair instruction when a check fails.
Define the population and sample
Basic arithmetic and a spreadsheet or calculator. No calculus or paid statistics package.
The idea to use
Before calculation, define who could have been observed and who actually was. A sample of resolved afternoon tickets excludes unresolved work and other times of day. That selection can bias a service conclusion. Record the sampling method, time window and exclusions. More precise arithmetic cannot repair a poorly matched sample; the first deliverable is a scope statement.
Watch the selected lessons
Selected video time: 41m. Open this course on WikiFree.
Your 45-minute lab
Write the target population, observed sample and three likely omissions. Propose a better collection schedule.
Save: A sampling note..
Evidence check
It names unresolved tickets and other time periods as missing from this sample.
If it fails: Replace claims about all customers with claims about the six observed tickets.
Describe center and spread
Bring your previous output: A sampling note.
The idea to use
Sort the values before calculating the median. With an even count, average the two middle values. Report units and sample size next to a statistic. Mean, median and range answer different questions; showing several summaries makes the influence of unusual observations visible. Preserve the raw rows so someone else can reproduce your summary.
Watch the selected lessons
Selected video time: 19m. Open this course on WikiFree.
Your 55-minute lab
Calculate mean, median, minimum, maximum and range. Draw a dot plot with one mark per ticket.
Save: A labeled descriptive table and dot plot..
Evidence check
Mean 6; median 3.5; minimum 2; maximum 18; range 16 minutes; n=6.
If it fails: Do not average only unique values or leave units off the chart.
Investigate the long wait
Bring your previous output: A labeled descriptive table and dot plot.
The idea to use
An unusual value is a question, not permission to delete a row. Check whether 18 is an entry error, a valid exception or evidence of a different process. Compare the full sample with a clearly labeled sensitivity summary that excludes it. The five-row mean becomes 3.6, showing why the exclusion decision materially changes the story.
Watch the selected lessons
Selected video time: 15m. Open this course on WikiFree.
Your 50-minute lab
Create an issue log for T6 and compute summaries with and without it. Keep both versions and state which is primary.
Save: An outlier investigation and sensitivity comparison..
Evidence check
The six-row summary remains primary unless evidence supports correction; the exclusion is disclosed.
If it fails: Never silently remove a slow ticket because it makes service look better.
Separate relationship from explanation
Bring your previous output: An outlier investigation and sensitivity comparison.
The idea to use
A relationship between two measured variables may arise from other factors or the collection process. Our six rows contain only waiting time; they cannot establish whether staffing caused the long wait. A sound next study records relevant context, defines comparable groups and checks alternative explanations. Do not draw a causal chart from columns that were never collected.
Watch the selected lessons
Selected video time: 32m. Open this course on WikiFree.
Your 45-minute lab
Draft a follow-up data dictionary containing shift, arrival time, queue size and staffing count. Write a testable association question and two alternative explanations.
Save: A follow-up study plan..
Evidence check
The plan distinguishes an association question from a causal claim and defines each field.
If it fails: If the memo says understaffing caused T6, replace that statement with an evidence request.
Write a proportion carefully
Bring your previous output: A follow-up study plan.
The idea to use
An observed proportion is a count divided by a defined denominator. Here five of six tickets waited at most six minutes. That fraction is descriptive; it is not a reliable promise about the next customer or a population confidence statement. A decision memo should show the fraction, the small sample and the collection limits together.
Watch the selected lessons
Selected video time: 25m. Open this course on WikiFree.
Your 50-minute lab
Calculate the observed share at or below six minutes. Write a 200-word memo recommending one next collection action.
Save: A bounded statistical decision memo..
Evidence check
It states 5/6, about 83.3%, for this sample only and avoids an unsupported population guarantee.
If it fails: Do not convert the sample proportion into a service-level promise.
A worked reference to compare
The sample mean is 6 minutes, while the median is 3.5. Excluding T6 changes the mean to 3.6; that is a sensitivity result, not a cleaned truth. The next useful action is broader, consistently collected evidence rather than an immediate causal verdict.
Compare your reasoning as well as the result. If your answer differs, state the assumption or input that explains the difference. Reference notes are for checking after an attempt; copying them is not evidence of independent work.
Your final project
Your brief
Deliver the raw table, summaries, dot plot, outlier log and decision memo. Add waits of 5 and 7 from the next shift, recalculate all summaries and explain why the expanded convenience sample still has limits.
Time box: 2h 30m estimated. Extend it if a gate needs repair.
Hand in these artifacts
- A sampling note.
- A labeled descriptive table and dot plot.
- An outlier investigation and sensitivity comparison.
- A follow-up study plan.
- A bounded statistical decision memo.
- A short README: outcome, how to inspect or run the work, assumptions and limitations.
- A before-and-after change test and the completed evidence log.
Run a final review
- Use the supplied reference to reconcile the baseline result.
- Choose one relevant input or constraint to change. Write your expected effect before testing it.
- Run the calculation, walkthrough or test again and save the actual result.
- Ask a peer to inspect the evidence, or perform a separate self-review. Label which review you used.
- Score the work using the rubric and repair every critical failure.
Review rubric · 100 points
| Criterion | Points | Evidence to inspect |
|---|---|---|
| Practical outcome and case reasoning | 25 | Summarize a small business sample, investigate an outlier and write a decision memo that separates observations from unsupported generalizations. |
| Five stage checks | 30 | Award 6 points for each stage only when its stated gate is demonstrably met. |
| Traceable evidence | 20 | Artifacts, inputs and calculations or tests are reproducible; synthetic and simulated evidence is labelled. |
| Revision after a changed condition | 15 | Change one input or constraint, predict the effect, test it and record the result. |
| Handoff quality | 10 | A reviewer can find the files, follow the instructions and understand the remaining limitations. |
Completion target: at least 80/100, all five stage gates passed, and every critical issue below corrected. This is a learning benchmark, not an accredited qualification.
Critical issue: No row is silently removed and no sample result is presented as proven causation or a population guarantee.
Before you go further
What will I be able to produce?
Summarize a small business sample, investigate an outlier and write a decision memo that separates observations from unsupported generalizations.
Is the whole path free?
Assigned public videos can be watched free. Complete the original case in a text editor, on paper or in a spreadsheet you already have. No paid course, exam or provider certificate is included.
Do I need to finish every source course?
No. Follow the selected assignments at each stage. Source courses provide context, while the original case, labs and final review build the practical result. Extra study is optional.
What counts as completion?
Complete all five stage checks, earn at least 80/100 on the final rubric and correct every critical issue. This is descriptive statistical reasoning, not a complete inference, forecasting or experimental-design course.
Questions & discussion
Share a useful question or correction. Comments appear after moderation. Please avoid personal or sensitive information.