WikiFree learning paths / 03 · The evidence desk
The evidence desk
A decision is only as strong as its evidence.
Clean a small sales dataset, compare channels fairly and write a one-page recommendation that another person can reproduce.
Northstar / synthetic sample
Follow the evidence.
- Beginner
- starting level
- 1
- core course
- ≈17h
- learning + practice estimate
- 5 + 1
- stages + final project
The practical outcome
What you will be able to show
Clean a small sales dataset, compare channels fairly and write a one-page recommendation that another person can reproduce.
For: Beginners who can enter data in a spreadsheet and calculate a percentage.
Before you begin: A computer, a spreadsheet editor and basic arithmetic. No SQL, R, paid dashboard tool or previous analyst role is required.
Original pathway and exercises by WikiFree Editorial. Course pages and official source metadata reviewed on 12 October 2026. Version 1.0.
A ten-minute starting check
Try these before opening a lesson
Answer in your own words, then reveal the guidance. If you can already demonstrate a stage’s completion gate with evidence, skim its lesson assignment and move to the next stage.
Turn 18 completed orders out of 24 into a rate.
75%; keep the denominator in your explanation.
Two rows share the same order ID. Is one automatically safe to delete?
Only after checking whether they represent the same event and documenting the rule.
Can higher sales from one channel prove that the channel caused the difference?
No. Audience, timing and selection can differ.
Sequence with a purpose
Build one layer at a time
- 01Frame the decisionA signed-off question brief.
- 02Inspect the evidenceA data dictionary and an issue log.
- 03Clean with an audit trailClean data plus a transformation log.
- 04Compare like with likeA labeled chart and reconciled summary table.
- 05Make a bounded recommendationA one-page evidence brief.
Finish with the capstone. Progress means a reviewable output, not simply a watched video.
A deliberately short course list
Use these courses for these reasons
Free Data Analytics Course: Spreadsheets, SQL and R
Google · Beginner · English
One course supplies the question, quality, analysis and communication foundations. We select spreadsheet-friendly lessons; SQL, R and career videos remain optional within the full course.
Assigned viewing: 5h 40m 27s. The full source course contains additional material.
Open the WikiFree course and official learning route ↗Free learning, clearly defined
Selected YouTube lessons are free to view. Use a spreadsheet you already have or free LibreOffice Calc for the original exercises. A Google certificate is not included. Interface features differ between spreadsheet applications.
Skills and evidence
| Stage / skill | Learning support | Evidence to produce |
|---|---|---|
| 01 · Frame the decision | Google selected lessons | A signed-off question brief. |
| 02 · Inspect the evidence | Google selected lessons | A data dictionary and an issue log. |
| 03 · Clean with an audit trail | Google selected lessons | Clean data plus a transformation log. |
| 04 · Compare like with like | Google selected lessons | A labeled chart and reconciled summary table. |
| 05 · Make a bounded recommendation | Google selected lessons | A one-page evidence brief. |
Stage 1 / The evidence desk
Frame the decision
You will: Turn a broad request into a measurable question.
Assigned learning
Free Data Analytics Course: Spreadsheets, SQL and R
- Lesson 29 · Problem Solving with Data Analytics
- Lesson 28 · Making Data-driven Decisions in Business
Use the names if the provider later changes the order. Only these assignments enter the core estimate.
Start with the decision owner and the action they could take. “Find insights” has no stopping rule. “Which channel deserves a small follow-up test, based on completed revenue in this sample?” defines a usable comparison. Write the unit of analysis before calculating: one row should represent one order, not one customer.
Separate the outcome measure from evidence quality. Completed revenue is a value measure; duplicate rate is a quality measure. A large revenue number does not repair a broken export.
Make something reviewable
Write a five-line analysis brief: decision, owner, population, primary metric and one limitation. List two plausible explanations for a channel difference other than channel quality.
Deliver: A signed-off question brief.
Completion gate
A peer can name the proposed action and exactly which orders enter the metric.
If you get stuck: If your question cannot change a decision, narrow it to one choice. If “best” is undefined, replace it with a named measure and time window.
Stage 2 / The evidence desk
Inspect the evidence
You will: Describe fields, types and provenance before editing.
Assigned learning
Free Data Analytics Course: Spreadsheets, SQL and R
- Lesson 25 · Understanding Data Types and Structures
- Lesson 24 · Ensuring Credibility in Your Data
Use the names if the provider later changes the order. Only these assignments enter the core estimate.
Keep the raw export unchanged. Make a working copy and a data dictionary with one meaning per column. IDs are labels even when they contain digits. Quantity and unit price are numeric; status and channel are categories. A blank quantity means unknown, not zero.
The supplied file is synthetic training data. It has no customer identities and should never be described as a real shop study. Its two week labels are categories, not a long-term trend.
Make something reviewable
Inspect every column in the supplied dataset. Record row count, distinct order IDs, blank fields, unexpected categories and impossible quantities before fixing anything.
Deliver: A data dictionary and an issue log.
Completion gate
You preserve the raw file and identify the repeated ID and the incomplete or invalid quantities.
If you get stuck: Do not guess missing values. If spreadsheet import changes an ID, reimport that column as text and document the correction.
Stage 3 / The evidence desk
Clean with an audit trail
You will: Create a reproducible inclusion rule.
Assigned learning
Free Data Analytics Course: Spreadsheets, SQL and R
- Lesson 19 · Understanding Data Cleaning
- Lesson 18 · How to Report Your Clean Data
Use the names if the provider later changes the order. Only these assignments enter the core estimate.
Apply the supplied rulebook in a fixed order: retain one copy of an exact duplicate; quarantine missing, nonnumeric or nonpositive quantities; normalize known channel labels after trimming spaces; retain an unrecognized channel as Unknown; and exclude cancelled orders from completed revenue. Keep excluded rows in a separate log.
Unknown channel revenue belongs in the overall total even when it cannot support a named-channel recommendation. Deleting it makes the chart look cleaner while weakening the analysis.
Make something reviewable
Create clean, quarantine and duplicate tables. Add a reason beside every removed row. Count the records after each step, then reconcile the final eligible records back to the original export.
Deliver: Clean data plus a transformation log.
Completion gate
Every raw row is accounted for once; no missing quantity has become zero; rerunning the steps produces the same totals.
If you get stuck: If totals move unexpectedly, undo the last step and compare row counts. Check whether filtering hid rows before copying a table.
Stage 4 / The evidence desk
Compare like with like
You will: Calculate channel totals without double counting.
Assigned learning
Free Data Analytics Course: Spreadsheets, SQL and R
- Lesson 15 · Analyze Data to Answer Questions
- Lesson 14 · Aggregating Data for Analysis
Use the names if the provider later changes the order. Only these assignments enter the core estimate.
For each eligible order, calculate quantity × unit price. Sum that value by channel and count included orders. Divide revenue by included orders to obtain average order value; do not average precomputed channel averages to obtain a grand average.
A channel with more revenue may simply have more orders. Show both revenue and order count. Your sample has no reliable acquisition-cost or exposure data, so it cannot establish profitability, conversion rate or return on ad spend.
Make something reviewable
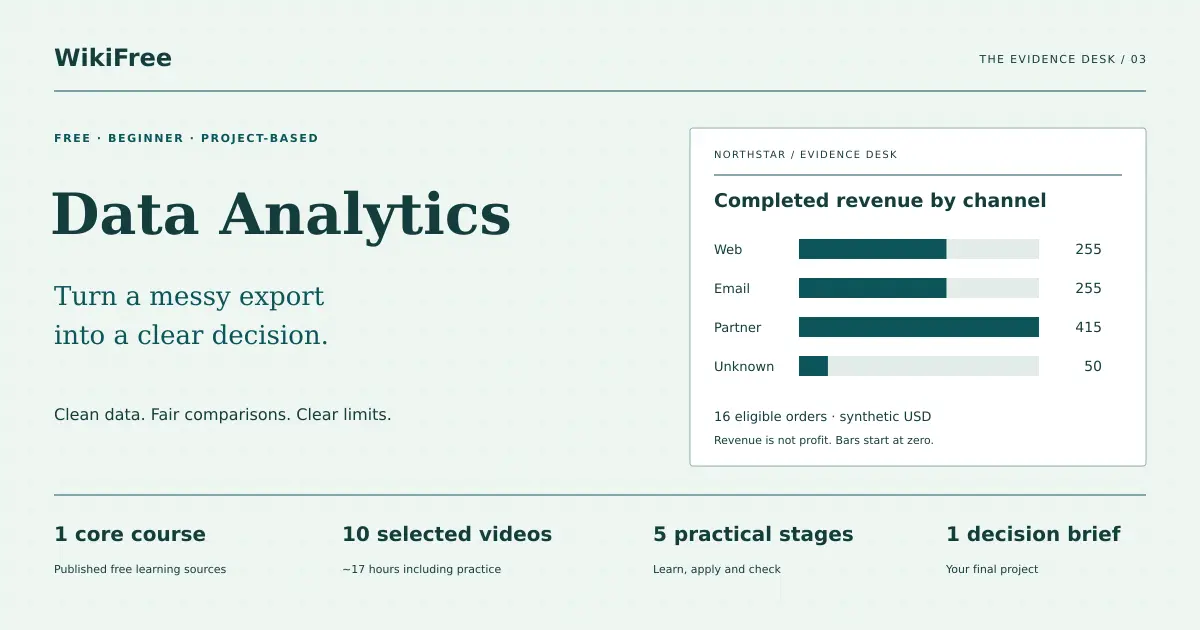
Build a channel summary and one bar chart starting at zero. Independently check the total using a separate SUM calculation, then reconcile revenue including Unknown.
Deliver: A labeled chart and reconciled summary table.
Completion gate
Totals agree; the chart names the metric and sample; you do not label revenue as profit or call order share a conversion rate.
If you get stuck: If the chart changes after sorting, check its range and labels. If averages disagree, calculate from total revenue and total count.
Stage 5 / The evidence desk
Make a bounded recommendation
You will: Explain an action, its evidence and uncertainty.
Assigned learning
Free Data Analytics Course: Spreadsheets, SQL and R
- Lesson 11 · The Recipe for Powerful Data Visualization
- Lesson 8 · Best Practices for Presenting Data
Use the names if the provider later changes the order. Only these assignments enter the core estimate.
A useful briefing has a recommendation, two supporting numbers and a limit. Keep observation separate from interpretation: “Partner has the largest completed revenue in this sample” is observable; “Partner will always win” is not.
Recommend a small next test with a success measure and a stop condition. Give the manager a way to reduce uncertainty, such as collecting channel exposure and cost consistently during the next period.
Make something reviewable
Write a 150–200 word decision memo. Add the chart, a cleaning footnote, one alternative interpretation and the next measurement you would collect.
Deliver: A one-page evidence brief.
Completion gate
Every numerical statement traces to a cell; the memo contains a limitation and an actionable next test.
If you get stuck: If the memo mostly narrates the chart, put the decision in the first sentence. Remove claims the dataset cannot measure.
Original practice material
Your case pack and reference checks
Download the editable plain-text workbook, or open the full copy below. It contains the case inputs, templates and reference guidance. Try the exercises before reading the answers.
Download the practice workbook ↓ Download project files (ZIP) ↓Open the complete workbook in this page
WIKIFREE / THE EVIDENCE DESK
Original synthetic training case. Version 1.0 — 12 October 2026.
No real customer, company or transaction data. Currency: illustrative USD.

QUESTION
Which channel deserves a small follow-up experiment based on completed revenue
in this sample? You do not have acquisition costs or exposure counts.

RAW CSV — save the following as northstar_orders.csv. Do not edit the raw copy.
order_id,week,channel,quantity,unit_price,status
D001,Week 1,Web,2,20,Completed
D002,Week 1,Email,1,35,Completed
D003,Week 1,Partner,3,20,Completed
D004,Week 1,web ,1,50,Completed
D005,Week 1,Email,2,35,Completed
D006,Week 1,Partner,2,50,Completed
D007,Week 1,Web,1,20,Cancelled
D008,Week 1,,1,50,Completed
D009,Week 1,Partner,4,20,Completed
D010,Week 2,Web,3,20,Completed
D011,Week 2,Email,1,50,Completed
D012,Week 2,Partner,1,35,Cancelled
D013,Week 2,Web,2,35,Completed
D014,Week 2,Email,2,20,Completed
D015,Week 2,Partner,3,35,Completed
D016,Week 2,Web,1,35,Completed
D017,Week 2,Email,3,20,Completed
D018,Week 2,Partner,2,35,Completed
D004,Week 1,web ,1,50,Completed
D019,Week 2,Web,,20,Completed
D020,Week 2,Email,-1,35,Completed

RULEBOOK
One row represents one order. The CSV has six source fields; your clean table
adds a seventh field, revenue. Keep one copy of the exact duplicate D004.
Quarantine D019 (quantity missing) and D020 (quantity negative); do not guess.
Normalize channel labels after trimming spaces and ignoring letter case.
A missing/unrecognized channel becomes Unknown and remains in overall totals.
Completed revenue excludes cancelled orders. Do not treat cancelled orders as
zero-value completed orders. Retain exclusion reasons and reconcile row counts.

DATA DICTIONARY TEMPLATE
Field | Meaning | Type | Allowed values | Missing-value treatment

QUALITY LOG TEMPLATE
Raw line | Order ID | Issue | Action | Reason | Remaining limitation

ANALYSIS TEMPLATE
Decision owner:
Question and sample:
Primary metric and exact denominator:
Cleaning steps:
Channel | Eligible orders | Completed revenue | Average order value
Chart title, units and source note:
Recommendation:
Alternative explanation:
Next test and success measure:

REFERENCE CHECK — open after your attempt
{
  "raw_rows": 21,
  "exact_duplicates": 1,
  "invalid_rows": 2,
  "cancelled_rows": 2,
  "eligible_rows": 16,
  "revenue": 975,
  "channels": {
    "Web": {
      "orders": 5,
      "revenue": 255
    },
    "Email": {
      "orders": 5,
      "revenue": 255
    },
    "Partner": {
      "orders": 5,
      "revenue": 415
    },
    "Unknown": {
      "orders": 1,
      "revenue": 50
    }
  },
  "excluded": [
    [
      8,
      "D007",
      "Cancelled: outside metric"
    ],
    [
      13,
      "D012",
      "Cancelled: outside metric"
    ],
    [
      20,
      "D004",
      "Exact duplicate"
    ],
    [
      21,
      "D019",
      "Invalid or missing quantity"
    ],
    [
      22,
      "D020",
      "Invalid or missing quantity"
    ]
  ]
}
Reconciliation: 21 raw rows = 1 duplicate + 2 invalid + 2 cancelled + 16 eligible.
The grand total includes Unknown. A channel ranking cannot prove causation or
profitability. The dataset does not support a conversion-rate calculation.
Suggested next test: collect comparable channel exposure, cost and completed
orders over a stated period before increasing spending. This is an example of
a bounded recommendation, not the only acceptable answer.
Case data, exercises and reference examples: WikiFree Editorial, original training material. Provider lessons are linked, not reproduced.
Final project / 3h practice estimate
The Northstar channel decision
Rebuild the analysis from the raw export, then hand it to a reviewer who has not seen your working process. Recommend one modest channel test and explain why the evidence is still incomplete.
Your handover package
- Raw file, clean table and exclusion log with documented rules
- A data dictionary, channel summary and one readable chart
- A one-page recommendation with source notes, limitations and next-test design
- A reproducibility note: application, formulas or steps, and independent total check
| Criterion | Points | Evidence expected |
|---|---|---|
| Data quality and reconciliation | 30 | Every raw row is accounted for and the duplicate/invalid cases are handled correctly. |
| Calculations | 30 | Eligible revenue, order counts and averages reconcile; unsupported metrics are absent. |
| Decision and uncertainty | 25 | The recommendation follows the evidence and proposes a measurable follow-up. |
| Communication | 15 | The chart, labels, memo and reproducibility note can be understood without a live explanation. |
Completion standard: aim for at least 80/100, with all critical gates met. A reviewer awards each row’s points in proportion to the evidence shown. This is a learning rubric, not a provider credential.
A broken reconciliation or fabricated metric must be corrected before passing, even if the total score exceeds 80.
A pace that leaves room to practice
Plan the next few weeks
Assigned viewing: 5h 40m 27s. Practice and capstone: 11.0 hours, editorial estimate. Budget about 17 hours overall. Replays and personal adaptations can take longer.
| Available time | Flexible estimate | How to use it |
|---|---|---|
| 2 hours/week | 9 weeks | Reserve time to make the output and pass its gate; split a long lesson across sessions. |
| 5 hours/week | 4 weeks | Reserve time to make the output and pass its gate; split a long lesson across sessions. |
| 10 hours/week | 2 weeks | Reserve time to make the output and pass its gate; split a long lesson across sessions. |
The calculation stays in your browser. The estimates above remain usable without JavaScript.
Checkbox progress is saved only in this browser when local storage is available. It is not sent to WikiFree or synchronized to an account.
Questions before you continue
Do I need to learn SQL or R first?
No. This route deliberately selects the spreadsheet and analysis foundations. SQL and R are useful later, but they do not replace the quality checks in this project.
May I use a larger real dataset?
Yes, if you are allowed to use it and can document its meaning and exclusions. Remove personal information before sharing your portfolio.
Sources and honest boundaries
What was checked, and what comes next
This is a first business-analysis project, not a complete data-analyst qualification. SQL, R, statistical inference and production dashboards are outside its assessed outcome.
The complete published WikiFree course catalog was checked on 12 October 2026: 815 courses across nine API pages. Course pages and official playlist metadata or module headings were inspected. This does not mean every video was played to completion, every geographic region was tested, or a provider credential was earned.
- Google · official source for Free Data Analytics Course: Spreadsheets, SQL and R
- LibreOffice Calc help
Keep the published course pages as your route into provider material. Access, lesson order and tool interfaces can change. Report a broken route through WikiFree’s correction page.
Questions & discussion
Share a useful question or correction. Comments appear after moderation. Please avoid personal or sensitive information.